Keeping track of "VHF & up"
amateur-radio psk-reporter mqtt prometheustldr; I need to monitor the lower portion of “VHF & up”, so that I can get on air once there’s some increase in activity. My home QTH isn’t equipped with any kind of permanent radio station, which means that operating will always require some amount of setting-up and subsequent tearing-down, which I’d prefer not to do if the bands are supposedly dead. There’s also very little room for antenna installation on our balcony, which has been one of the main reasons driving me towards these higher frequencies, where smaller and lighter antennas are a thing, to begin with.
I can work man-portable HF in the woods with different dipoles, but that requires actually going to those woods, and getting an HF antenna up requires a nice spot with e.g. suitable trees to hang the antenna from. Being able to get on air from e.g. the balcony with a small antenna is a big plus and much less of a hassle. Smaller and lighter antennas also translate to better portability, and more flexible set-up in the field context; which way your tree-supported dipole will be pointing depends heavily on the trees that are available. But if the antenna is small enough to be supported by e.g. camera stand-type equipment, pointing in the right direction becomes easy.
One approach that could be taken to scout the bands would be to look at PSK Reporter’s map. That works, up to a limit, but has some obvious downsides like inability to follow more than one band at a time. Enter mqtt.pskreporter.info, a very neat service which provides a stream of PSK Reporter’s spots for programmatic consumption. My take on this consumption is kahara/vushf-exporter, a simple program which consumes the stream of spots for configured bands, counts the totals, and exposes them for Prometheus’ consumption over HTTP. The approach taken is “less is more”, and I’m purposefully not looking at things like spot distances or (perceived) signal levels. From Prometheus the data could be used for dashboarding with Grafana, and alerting with Alertmanager (maybe).
Here are two screenshots showing some Druckprüfungen during and after a recent 70cm Nordic Activity Contest:

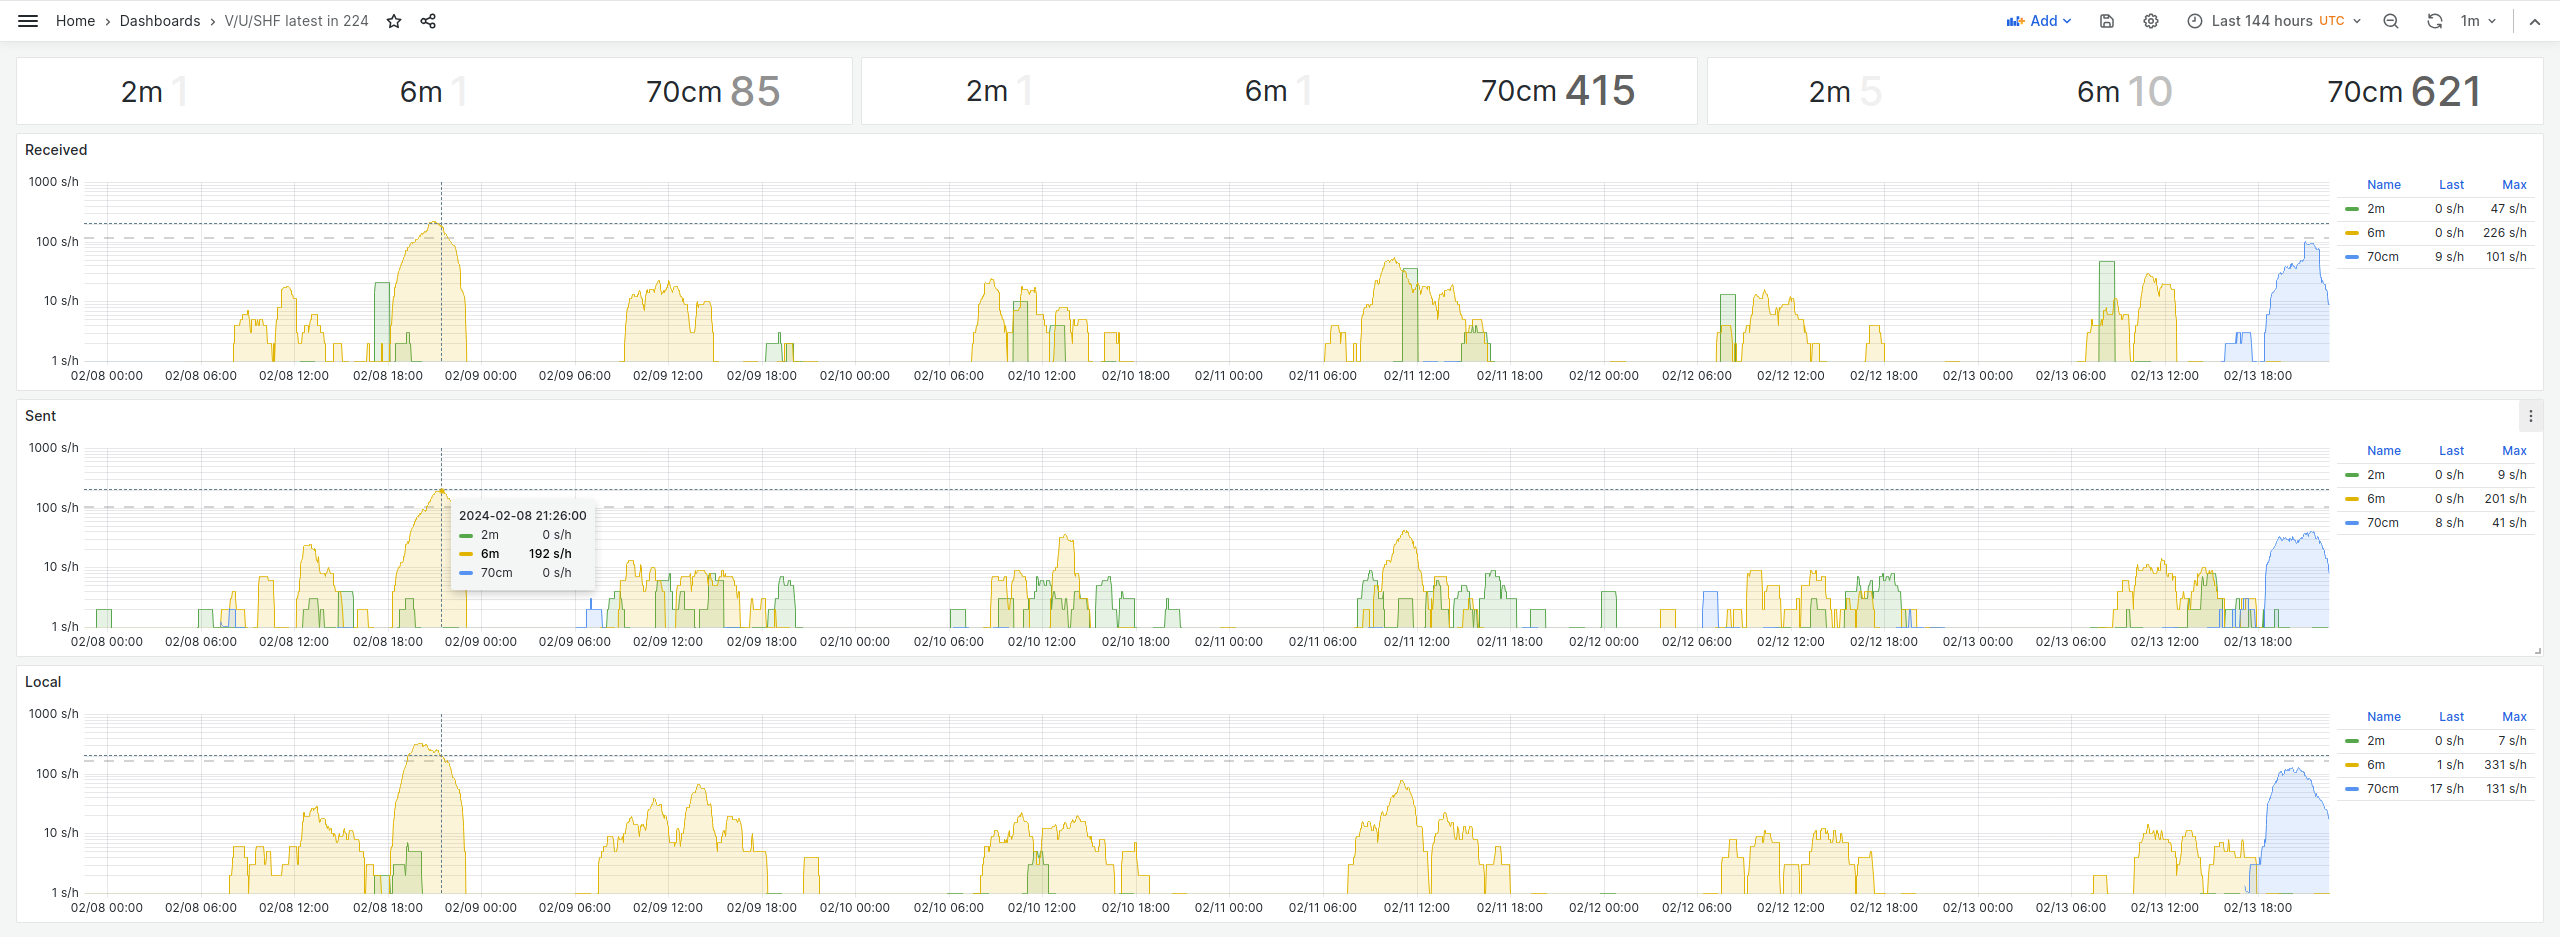
Primary advantages I’m gaining from this are that spot counts on multiple bands of interest can be monitored simultaneously and, because the exposed metrics are split by direction (received, sent, local), I should be able to easily see if propagation on a given band is confined to Finland, or if band is more wide open. From these simple facts I’m hoping to be able to come to some useful conclusions. Let’s see how well my assumptions work out in real life, once the bands start heating up as we get closer to summer solstice.🤞